Working Capital & Cash Flow

A 25-part series examining working capital & cash flow and their operational impact

BROWSE POSTS
Browse by: Date
Illustration of executives standing beside a stable structure while unseen cracks form at its foundation, signaling hidden working capital erosion

Article 01 — Why Working Capital Erodes Without Visible Warning

By Analyst Team

March 20, 2026 — The quarterly review had gone well. Revenue was on track.

Illustration of an executive observing a grid of customer accounts with scattered warning signals indicating inconsistent payment behavior and rising commercial risk

Article 02 — How Receivables Behavior Signals Commercial Risk

By Analyst Team

March 20, 2026 — The receivables report had looked acceptable for 3 consecutive quarters. Current receivables were healthy.

Illustration of an executive walking through rows of inventory with a highlighted excess unit, showing how stock accumulation restricts available cash

Article 03 — When Inventory Levels Become a Cash Flow Problem

By Analyst Team

March 20, 2026 — The warehouse had never been fuller. The operations team was proud of it.

Illustration of an executive adjusting a payment structure with a highlighted block, showing how payables decisions influence broader financial outcomes

Article 04 — Why Payables Strategy Affects More Than Cash Timing

By Analyst Team

March 20, 2026 — The finance team had been proud of the payment process. Invoices were cleared within 10 days of receipt.

Illustration of an executive observing connected operational stages, showing how receivables, inventory, and payables link together to determine capital requirements

Article 05 — How the Cash Conversion Cycle Shapes Capital Requirements

By Analyst Team

March 20, 2026 — Two businesses in the same industry, serving similar customers, generating similar revenue. One was consistently cash-generative, funding its own growth without external financing.

Illustration of an executive reviewing positive financial metrics while cash visibly leaks from the underlying operation behind him

Article 06 — Why Working Capital Ratios Miss the Operational Reality

By Analyst Team

March 20, 2026 — The current ratio was 2.1. By the standard interpretation that number indicated a healthy working capital position.
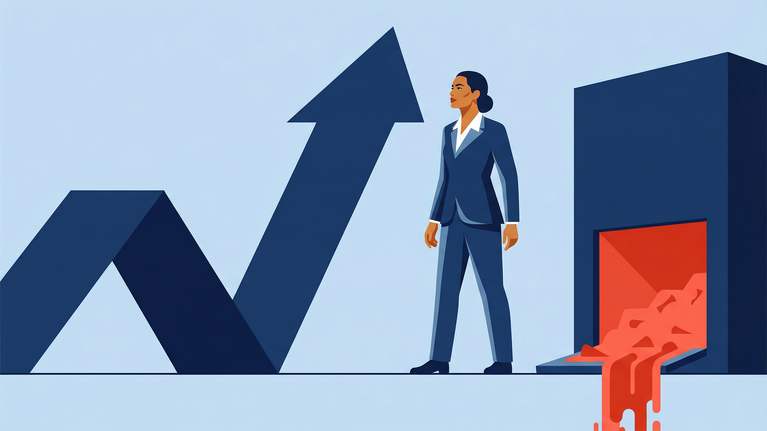
Illustration of an executive observing rising revenue growth while cash visibly drains from the business, showing how expansion consumes capital faster than expected

Article 07 — How Revenue Growth Consumes Capital Faster Than Expected

By Analyst Team

March 20, 2026 — The Series B had closed in January. $18M raised.

Illustration of an executive standing at the edge of a widening gap separating the business from collected cash, showing how persistent collection delays become structural barriers

Article 08 — When Collection Gaps Become Structural Not Situational

By Analyst Team

March 20, 2026 — The collections conversation had become a monthly ritual. The finance team reported the aging balance.

Illustration of an executive standing on a structure with a small visible surface and a much larger hidden base below, representing how supplier terms create unseen balance sheet risk

Article 09 — Why Supplier Terms Create Hidden Balance Sheet Risk

By Analyst Team

March 20, 2026 — The procurement team had done excellent work. 3 years of relationship building with a core group of suppliers had produced favorable pricing, reliable delivery, and preferential access during supply constraint periods.

Illustration of an executive standing between rising and falling demand waves, with cracks forming at the base during transitions, revealing underlying working capital weakness

Article 10 — How Seasonal Patterns Expose Working Capital Weakness

By Analyst Team

March 20, 2026 — The Q3 cash pressure had happened every year for 4 years. Each time it arrived it was explained as a seasonal phenomenon.

Illustration of an executive observing a tilted balance where one large revenue source outweighs several smaller ones, showing how concentration creates financial fragility

Article 11 — Why Revenue Concentration Creates Cash Flow Fragility

By Analyst Team

March 20, 2026 — The top 3 customers represented 71% of revenue. The sales team was proud of those relationships.

Illustration of executives interacting with a secured vault and a restricted access gauge, showing how working capital decisions determine access to financing and borrowing capacity

Article 12 — How Working Capital Decisions Affect Borrowing Capacity

By Analyst Team

March 20, 2026 — The credit application had been straightforward to prepare. 3 years of audited financials.

Illustration of an executive observing a system of interconnected pipes with a leaking valve, showing how underlying margin inefficiencies create visible cash flow pressure

Article 13 — When Cash Flow Pressure Is a Margin Problem in Disguise

By Analyst Team

March 20, 2026 — The working capital review had produced a clean diagnosis. Receivables were aging slightly but within acceptable range.

Illustration of an executive driving rapid upward growth supported by a small underlying cash base, showing how expansion can outpace available liquidity

Article 14 — Why Fast Growth Businesses Run Out of Cash

By Analyst Team

March 20, 2026 — The revenue chart looked exceptional. Up 180% year over year.

Illustration of an executive standing between inventory shelves with a highlighted unit, showing how procurement decisions influence overall working capital position

Article 15 — How Procurement Decisions Affect Working Capital Position

By Analyst Team

March 20, 2026 — The procurement team had negotiated an exceptional deal. A 12% price reduction in exchange for a volume commitment that required purchasing 6 months of supply in a single order.

Illustration of an executive closely monitoring a timing mechanism with a highlighted window, showing how small invoice timing shifts create outsized cash flow impact

Article 16 — Why Invoice Timing Has Outsized Cash Flow Consequences

By Analyst Team

March 20, 2026 — The delivery had been completed on the 3rd of the month. The invoice had gone out on the 29th.

Illustration of two executives negotiating across a balance scale where payment terms shift the weight, showing how customer agreements directly impact capital requirements

Article 17 — How Customer Payment Terms Shape Capital Requirements

By Analyst Team

March 20, 2026 — The enterprise contract had taken 7 months to close. The commercial team had done exceptional work.

Illustration of an executive facing a solid structure while a thin underlying layer expands beneath it, showing how working capital can conceal deeper cost structure issues

Article 18 — When Working Capital Masks a Cost Structure Problem

By Analyst Team

March 20, 2026 — The working capital program had been running for 18 months. Days sales outstanding had improved by 8 days.

Illustration of an executive observing an hourglass with a slow, steady drop of cash falling, showing how reserves decline gradually without a single triggering event

Article 19 — Why Cash Reserves Deteriorate Without a Trigger Event

By Analyst Team

March 20, 2026 — The cash reserve policy had been set 3 years earlier. 90 days of operating expenses.

Illustration of an executive straining against a chain under tension, showing how debt obligations constrain and interact with operating cash flow

Article 20 — How Debt Service Interacts With Operating Cash Flow

By Analyst Team

March 20, 2026 — The term loan had made sense when it was taken. $6M at a favorable rate, structured to fund the equipment investment the business needed to support its next phase of growth.

Illustration of an executive forcing a straight projection onto a curved cash flow path, showing how forecasts fail to capture real operational dynamics

Article 21 — Why Cash Flow Forecasts Consistently Miss the Mark

By Analyst Team

March 20, 2026 — The forecast had been built with genuine rigor. Bottom-up revenue projections.

Illustration of an executive facing a branching structure of decisions with a risk path cutting through, showing how capital allocation choices create downstream cash flow risk

Article 22 — How Capital Allocation Decisions Create Cash Flow Risk

By Analyst Team

March 20, 2026 — The investment committee had approved 4 initiatives in Q1. Each had been evaluated individually on its strategic merit and expected return.

Illustration of an executive holding an upward performance indicator while a separate downward cash flow trend collapses, showing divergence between profitability and cash generation

Article 23 — When Profitability and Cash Generation Diverge Permanently

By Analyst Team

March 20, 2026 — The business had been profitable for 6 consecutive years. Not marginally profitable.

Illustration of an executive observing misaligned operational structures with a disruption point emerging, showing how working capital control breaks down during periods of transition

Article 24 — Why Working Capital Management Fails During Transition

By Analyst Team

March 20, 2026 — The acquisition had closed on schedule. 18 months of planning, due diligence, and negotiation.

Illustration of an executive in front of structural pillars where one is stabilized by a precise support, showing how optimized cash conversion creates a sustained competitive advantage

Article 25 — How Cash Conversion Efficiency Becomes a Competitive Advantage

By Analyst Team

March 20, 2026 — Two competitors had started the decade at the same place. Same market.

Learn more about strategy & operation

Contact us

Contact us

Contact

Sign up to download

Topics of Interest: