

Revenue growth is not the same as organizational health. The two can coexist for years while structural problems accumulate beneath the surface. By the time growth slows, the problems it was funding are no longer invisible.
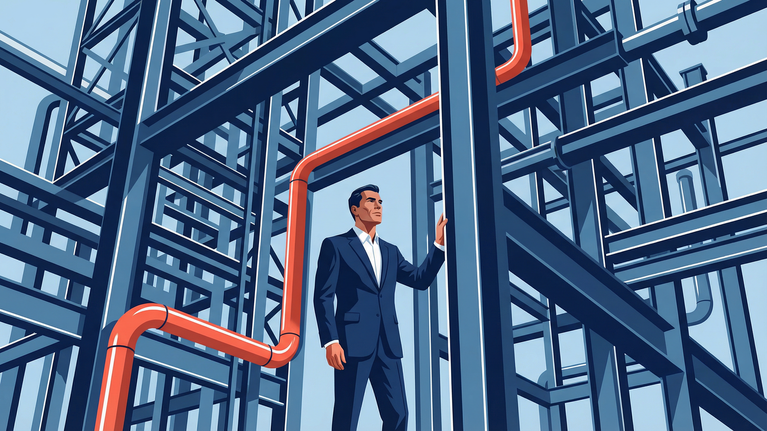
Complexity rarely arrives as a decision. It accumulates through thousands of individually reasonable choices that collectively produce an organization significantly harder and more expensive to run than its operating requirements justify.
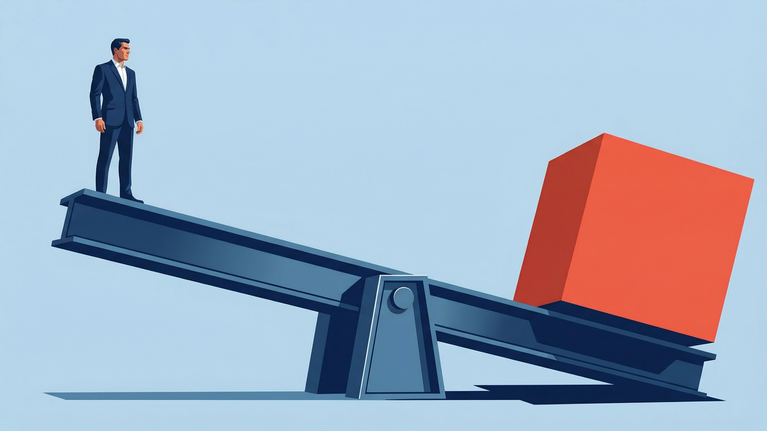
Labor is the largest cost in most organizations and the least understood as an economic variable. The businesses that manage it well do not treat it as a headcount problem. They treat it as a workforce design problem.
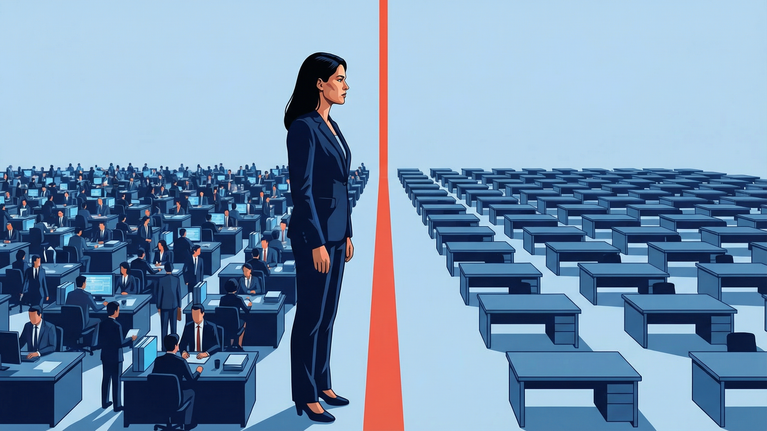
Workforce capacity misalignment rarely looks like a crisis. It looks like an operation that is always slightly off. Always covering gaps. Always running harder than it should to produce results that should come more easily.
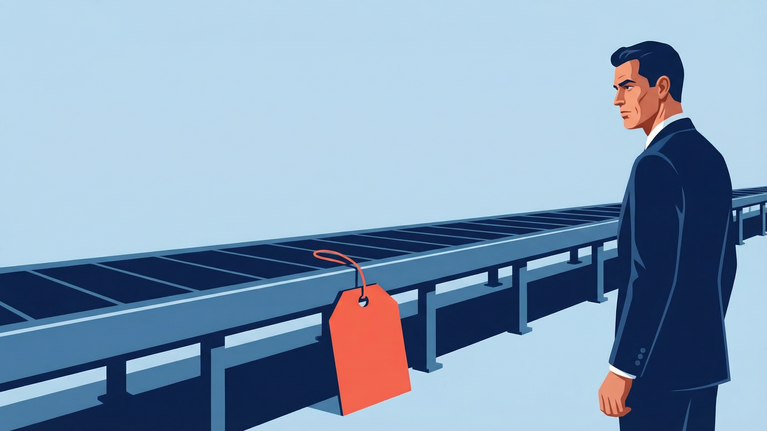
Idle labor capacity does not look like employees doing nothing. It looks like organizations paying for productive time that is being consumed by waiting, rework, and coordination overhead that the operating model never examined.
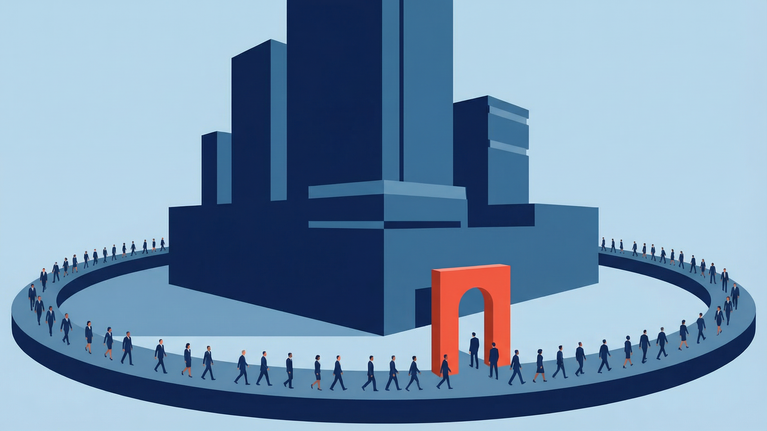
Most productivity initiatives target employee behavior and most productivity constraints are structural. That mismatch explains why so many productivity programs produce short-term movement and long-term disappointment.
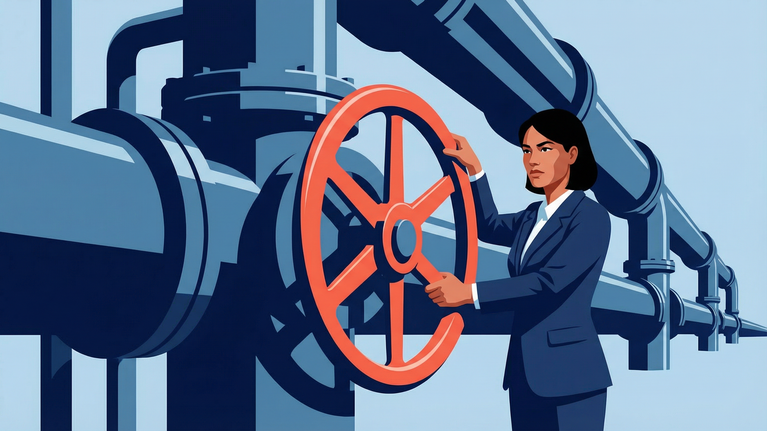
Internal friction does not appear on any cost report. It lives in the transitions between teams, the delays between decisions, and the energy spent navigating an organization that is more complex than the work it is trying to perform.
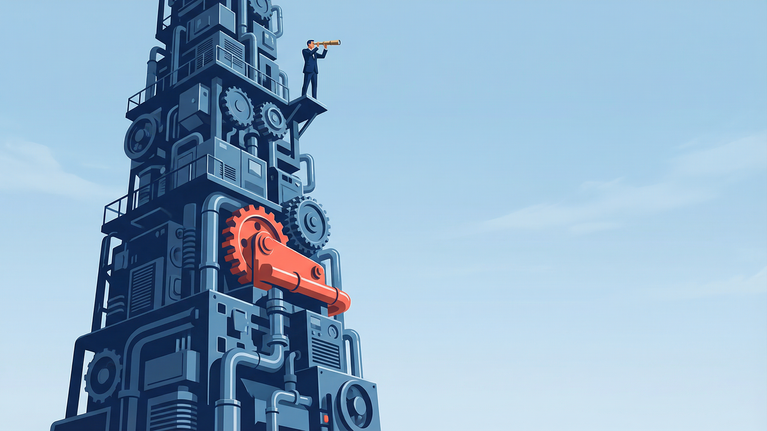
Leadership teams do not misread performance because they lack intelligence or commitment. They misread it because their reporting systems were built to confirm what happened, not to reveal what is developing.
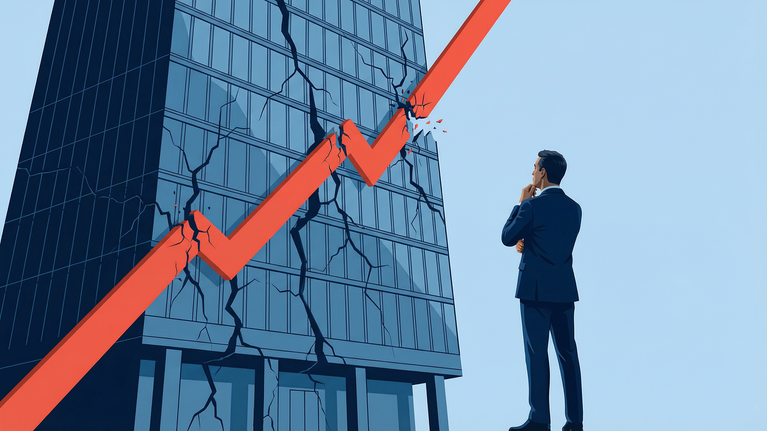
Revenue growth without operational readiness is not an achievement. It is a deferred liability. The costs of overextension accumulate in quality failures, employee turnover, and customer attrition before they appear in any financial
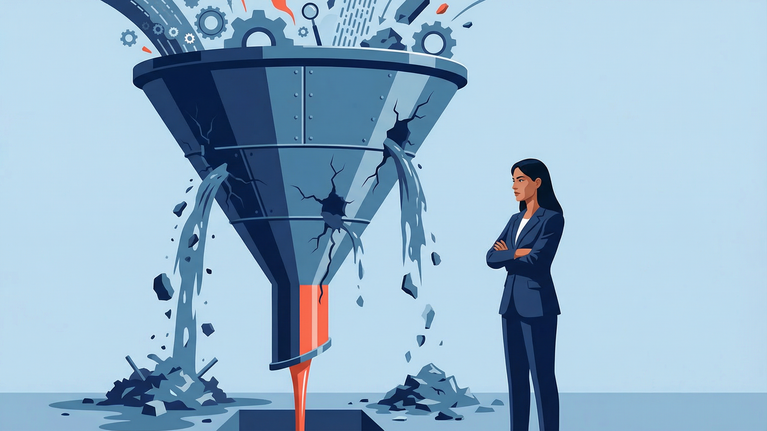
Every commercial exception has an operational consequence. The businesses that understand this build pricing governance that protects delivery capacity, not just margin. The ones that do not discover the connection when it is too late to avoid it.
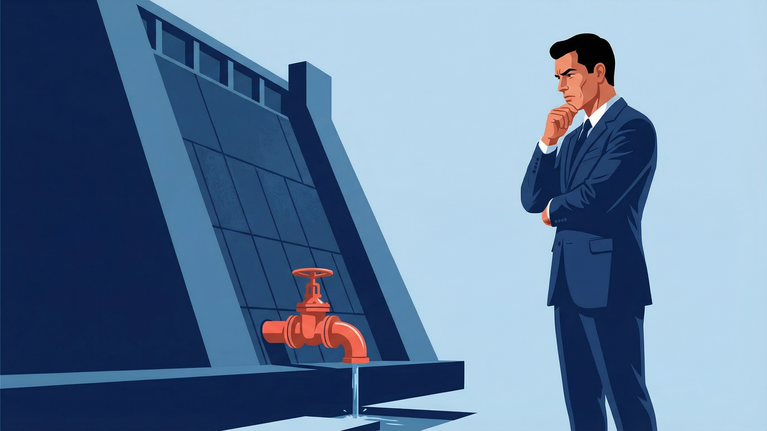
Profitability tells a business what it earned. Cash flow tells it what it can do. The businesses that confuse the two often discover the difference at exactly the wrong moment.

Slow decision cycles are not a cultural preference. They are a structural feature of governance systems that were built to prevent bad decisions rather than enable good ones. The cost of that design accumulates in every opportunity the organization identifies but cannot act on in time.
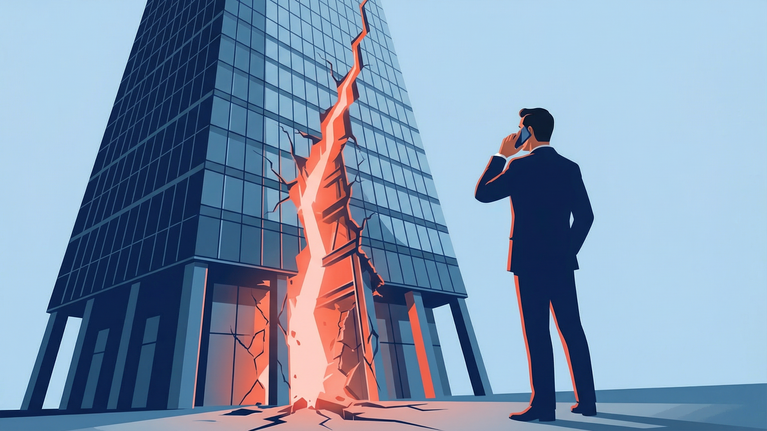
Performance breakdowns do not arrive suddenly. They develop through months of signals that each appear within acceptable range and none of which are examined together. By the time the pattern is undeniable, it has usually been visible in the data for a long time.
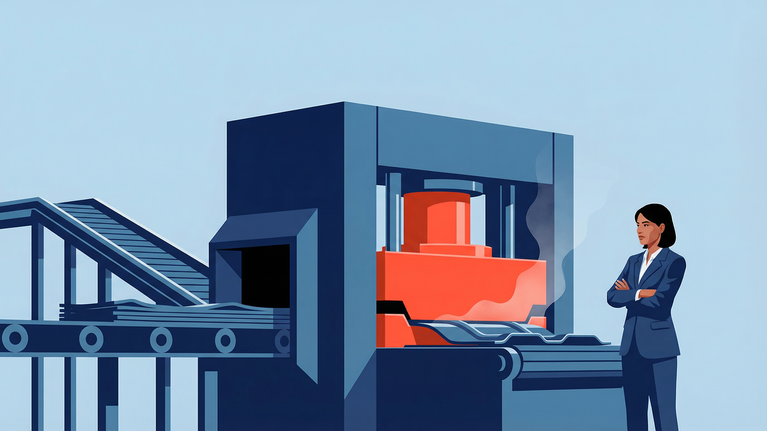
Organizations do not budget for friction. But they pay for it in every hour spent waiting, every rework cycle that should not have been necessary, and every coordination meeting that exists to manage complexity the operating model created.
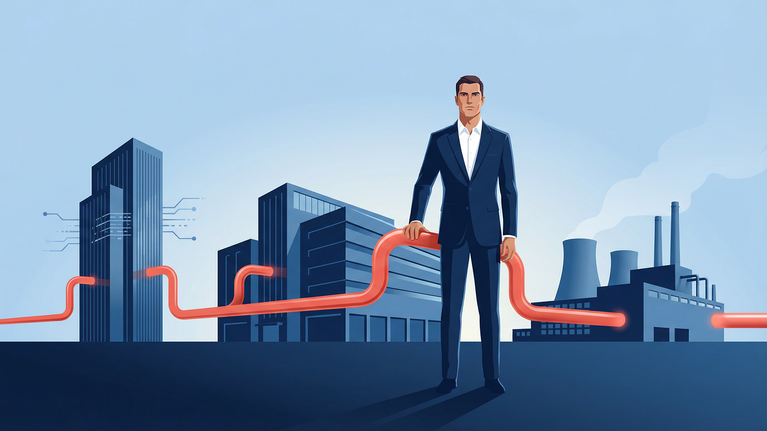
High performance is not a destination. It is a set of structural disciplines that compound over time. The organizations that sustain it are the ones that treat organizational health with the same seriousness they apply to commercial performance, because over time the two are inseparable.
Continue your analyses, email calculation records, and return to your work from one account.
By creating an account, you agree to the Terms of Use and acknowledge the Privacy Policy.
Enter the 6-digit code sent to .
